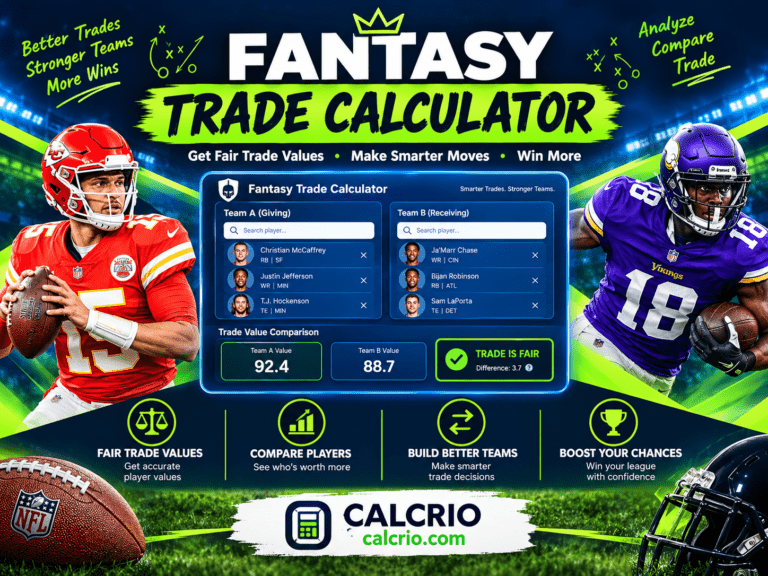
Fantasy Trade
Calculator
🏈 Fantasy Trade Calculator
Add players to both sides, compare total values, and see who wins the trade.
Fantasy Trade Calculator — Evaluate Every Trade in Football, Basketball & Baseball
A fantasy trade offer lands. Your gut says yes, but something feels off. Before you accept — or reject — a deal that could define your season, run it through a fantasy trade calculator. In 30 seconds, you’ll know whether you’re winning the trade, getting fleeced, or dealing with something right down the middle.
This guide explains how fantasy trade calculators work across every major sport and format — NFL redraft, dynasty football, fantasy baseball, and NBA fantasy — including how trade values are built, how to read your results, and the five situations where you should override what the calculator says.
Quick Answer — What Is a Fantasy Trade Calculator?
Quick Answer: A fantasy trade calculator is a free tool that evaluates whether a proposed trade is fair by comparing the assigned values of every player and draft pick on both sides. You enter the assets each team sends and receives; the calculator sums the total value of each package using player rankings, projections, or market data; and it returns a verdict — fair, slight edge, clear winner, or lopsided. Most calculators adjust values based on your league’s scoring format (PPR, standard, superflex) and league type (redraft, dynasty, keeper). They work for NFL fantasy football, NBA fantasy basketball, and fantasy baseball.
How a Fantasy Trade Calculator Actually Works
Understanding what’s happening under the hood makes you a much better user of any trade calculator — and helps you know when to trust the verdict and when to question it.
How Trade Values Are Built
Every fantasy trade calculator starts with a value assigned to each player. How that value is generated depends on the platform:
Expert-based values are set by analysts who rank players based on projected stats, opportunity, age, role, and situation. RotoWire’s dynasty calculator uses Jagger May’s dynasty rankings. Flock Fantasy’s calculator uses creator-backed expert consensus models. These values reflect what knowledgeable analysts believe a player is worth — not necessarily what the market would pay.
Crowdsourced values are built from actual user votes or rankings. <cite index=”31-1″>KeepTradeCut’s trade calculator uses crowdsourced values for players and picks from over 27 million data points provided by users.</cite> This reflects what the fantasy community collectively believes — which can be more accurate for gauging trade acceptance but occasionally reflects narrative or recency bias.
Real-trade values are derived from actual completed trades in live leagues. <cite index=”30-1″>RosterAudit ingests thousands of real dynasty trades every day from Sleeper leagues and feeds them into a market valuation engine, where each trade nudges player and pick ratings toward equilibrium and recent trades matter more, with outlier trades automatically down-weighted.</cite>
Each approach has strengths. Expert values are stable and analytically rigorous. Crowdsourced values reflect market sentiment. Real-trade values reflect what managers actually accept — consolidation premiums and all.
How the Two Sides Are Compared
Once every asset has a value, the calculator sums Team A’s total and Team B’s total. <cite index=”25-1″>The calculator scores every asset, compares the two sides, and tells you if the trade is fair, lopsided, or worth accepting — showing the total value of each trade package and charts and stats to back it up.</cite>
Most calculators then apply a percentage gap or point gap to quantify how lopsided the deal is. <cite index=”29-1″>One common scoring system scores each trade by percentage gap: under 5% is even, 5–15% is a slight edge, 15–30% is a clear winner, and 30% or more is lopsided.</cite>
What the Output Means (Grades, Gaps, Verdicts)
Different calculators display results differently, but the logic is the same:
| Output Format | What It Means | Example |
|---|---|---|
| Letter grade (A to F) | How well you did in the trade | A = strong win, C = fair, F = big loss |
| Win / Fair / Lose | Simple three-way verdict | Win = you got more value |
| Point gap | Raw value difference | +800 = you got 800 more points of value |
| % gap | Proportional difference | +12% = slight edge in your favor |
| Fairness rating /100 | Scaled fairness score | 85/100 = slightly in your favor |
A deal within roughly 5–10% on either side is generally considered fair. Beyond 15–20%, you’re either winning the trade clearly or giving up too much.
Fantasy Football Trade Calculator — NFL Guide
Fantasy football trade calculators are the most developed of any sport, with tools built for every format and scoring system.
Redraft Trade Calculator
In redraft leagues, every team starts fresh each season. Trade values are based entirely on rest-of-season production — how many fantasy points a player is projected to score between now and the end of the regular season or playoffs. <cite index=”19-1″>The tool compares what each team receives in a proposed trade and grades the deal based on projected value for the rest of the season, leaning on rest-of-season projections that power fantasy football rankings so trades are graded against real, current player values instead of a gut check.</cite>
Key inputs for redraft calculators:
- Scoring format: PPR, half-PPR, or standard — each changes how wide receivers and pass-catching running backs are valued
- Week: Trade values shift as the season progresses and remaining games decrease
- Injury status: A player on IR has near-zero redraft value regardless of their season-long ranking
Dynasty Fantasy Football Trade Calculator
Dynasty leagues never reset. You keep your roster year after year, which means trade values are calculated across a multi-year window — not just this season’s projections.
<cite index=”32-1″>A dynasty trade calculator helps you compare fantasy football trade value in long-term leagues, giving players and draft picks estimated values and showing whether each side looks fair, close, risky, or clearly uneven — because managers are not only trading players, but also trading age, upside, rookie picks, future picks, league settings, and playoff windows.</cite>
Dynasty values weigh three factors heavily:
Age. A 24-year-old wide receiver and a 30-year-old wide receiver might produce similar stats this season, but the younger player has 6–8 more years of value. Dynasty calculators apply age curves that significantly discount older players relative to their redraft value.
Opportunity and role. A young running back with a clear path to a feature role is worth more in dynasty than his current production suggests. Calculators factor in projected usage, depth chart position, and offensive system.
Rookie draft picks. In dynasty leagues, picks trade alongside players. A 2027 first-round pick might be worth a mid-tier starter, while a late-round pick in a weak class is worth much less. <cite index=”29-1″>Every calculator, ranking page, and trade analyzer provides values for 1QB, Superflex, and IDP formats, with rookie picks baked in so managers can mix players and picks on either side of any deal.</cite>
Keeper League Trade Calculator
Keeper leagues are a hybrid: you keep a set number of players from year to year but re-draft the rest. Trade values blend redraft and dynasty considerations — the player’s current season value matters, but so does how many years you can keep them and at what draft round cost.
Most standard fantasy football trade calculators can handle keeper trades by adjusting sliders between “redraft” and “dynasty” weighting based on your league’s specific keeper rules.
How Scoring Format Changes Player Values (PPR vs Standard vs Superflex)
The same calculator can return very different verdicts depending on your format:
| Format | Who Benefits | Example Impact |
|---|---|---|
| PPR (1 pt/reception) | WRs, pass-catching RBs, slot TEs | Davante Adams gains value vs standard |
| Half-PPR (0.5 pt/reception) | Balanced — slight WR/RB boost | Industry-standard compromise format |
| Standard (0 pt/reception) | Goal-line RBs, TD-dependent players | Feature backs with low reception work gain |
| Superflex / 2QB | QBs — dramatically more valuable | A second QB becomes a starter; QB value 2–3x |
| TE Premium (1.5 pt/reception) | Elite TEs (Travis Kelce tier) | Top TEs rival WR1 value |
Always set your scoring format before running any trade calculation. A PPR calculator verdict means nothing in a standard league.
Dynasty Fantasy Football Trade Calculator — Complete Guide
Dynasty football is where trade calculators earn their keep. The decisions are more complex, the consequences last longer, and the “gut feel” approach fails more often.
How Dynasty Values Differ from Redraft
| Factor | Redraft Value | Dynasty Value |
|---|---|---|
| Primary driver | Rest-of-season projections | Age + role + years of value remaining |
| Age 24 WR vs age 30 WR | Similar (if similar stats) | 24-year-old worth significantly more |
| Injury impact | Near-zero if IR | Reduced but not eliminated |
| Draft picks | Rarely included | Core trade currency |
| Time horizon | This season | Next 5–10 years |
| Rebuilding vs contending | Not relevant | Changes valuations significantly |
Trading Players vs Rookie Draft Picks
One of the trickiest parts of dynasty trades is valuing picks against players. <cite index=”24-1″>A dynasty trade calculator uses data from multiple expert sources to give each player a numerical trade value, making it easy to evaluate whether a trade is fair, with the NFL trade analyzer evaluating trades by calculating the total value of assets on each side — including players and draft picks.</cite>
General pick value framework:
| Pick | Typical Dynasty Value Equivalent |
|---|---|
| 2026 1st Round (1.01) | Young elite WR or RB starter |
| 2026 1st Round (1.05–1.08) | Solid young starter |
| 2026 1st Round (1.09–1.12) | Mid-tier young player |
| 2026 2nd Round (early) | Solid backup / young depth |
| 2026 2nd Round (late) | Depth piece only |
| 3rd Round + | Roster filler; rarely meaningful standalone |
Picks in weaker draft classes are worth less. Picks in deep rookie classes are worth more. A good dynasty calculator updates pick values as the class develops through the pre-draft process.
Contender vs Rebuilder Mode
<cite index=”21-1″>The ability to toggle between rebuilding or contending is one of the standout features of dynasty trade calculators. A rebuilding team will tend to prefer young players and draft picks while a contender might favor veterans, and you can balance out an uneven trade by deciding whether you want to receive assets fit for a contender or a rebuilder.</cite>
This toggle changes the verdicts meaningfully:
- Contending team trading a 2027 first-rounder for a proven WR2 might be “fair” in contender mode but “you lose” in rebuilder mode
- Rebuilding team accepting younger players over proven starters is often correct even if the raw point total looks slightly negative
Always set your team’s mode before analyzing dynasty trades.
Flock Fantasy Trade Calculator — What It Is and How It Works
The Flock Fantasy trade calculator is one of the most widely used dynasty football trade tools, built into the Flock Fantasy platform used by 250,000+ fantasy managers.
<cite index=”40-1″>Flock Fantasy’s trade calculator accounts for league size, starting lineup requirements, starting lineup size, roster size, and league scoring — and allows managers to link their league to have this information filled out automatically, with the option to use expert average rankings or specific creator rankings they prefer.</cite>
<cite index=”37-1″>The Flock Fantasy trade calculator includes an “Explain trade” feature that gives an explanation of how the trade will change your team’s rebuilding or contending power ranking, shows how it will change your team’s positional ranking in your league, and includes a share button to send your league mate a link to see the analysis.</cite>
<cite index=”36-1″>Flock’s trade calculator also provides recommendations on what players would help balance a trade, and allows managers to add any player into a deal — with players not currently on the selected roster greyed out so roster context is always visible.</cite>
The core concept behind Flock’s calculator — and most dynasty tools — is that trade values should reflect your specific league’s settings, not a universal standard. League size, starting requirements, and scoring format all shift what a player is actually worth to your team.
Fantasy Baseball Trade Calculator
Fantasy baseball trades require different thinking than football. The season is 162 games long, statistical categories matter as much as raw production, and rest-of-season projections shift dramatically based on injuries and role changes.
Rotisserie (Roto) vs Points Leagues
<cite index=”57-1″>In Roto leagues, teams compete in specific statistical categories and are ranked based on their performance in each category. In Points leagues, players earn points for various statistical achievements. This is crucial to understand before evaluating any trade.</cite>
Why this matters for trade evaluation:
In a standard 5×5 roto league (HR, RBI, R, SB, AVG / ERA, WHIP, K, W, SV), a speedy slap hitter with 40 stolen bases is enormously valuable — he contributes to one category no one else can cover. In a points league, those same 40 SB might be worth only 40 points while a power hitter’s 30 home runs are worth 120 points. Same player, very different value depending on your format.
<cite index=”55-1″>It is crucial to understand your specific league settings before agreeing to a trade. The differences between standard rotisserie and points leagues are significant — in category leagues, players are not directly penalized for strikeouts, but in points leagues, a given hitter could lose up to one full point per strikeout.</cite>
Rest-of-Season Value and Why It Matters
Unlike dynasty football, most fantasy baseball leagues are redraft-only. Trade calculators therefore focus on rest-of-season (ROS) value — projected contributions from today through the end of the regular season.
<cite index=”54-1″>The way a fantasy baseball trade value chart works is: look for the value of the player or players you’re giving up, compare it to the value of the players you’re getting in return, and if you’ve got more points coming back than you’re giving up, pull the trigger — though it’s not an exact science, and if the values are close but you like the player you’re getting back more, go ahead and make the trade.</cite>
ROS values plummet as the season ends. A player worth $25 in March is worth $5 in late August with only four weeks remaining.
Category Needs — The Hidden Factor
The best fantasy baseball trade calculators factor in not just raw player value, but your roster’s specific category deficiencies. <cite index=”55-1″>To win category leagues, managers must build a balanced team that finishes near the top five in each category. If your roster is in desperate need of saves but sitting in first in nearly all hitting metrics, it may be wise to pivot off a top power hitter to secure a closer — even if you take a slight hit in raw value on the trade.</cite>
A trade that looks slightly negative in raw value can be completely correct if it fills a category hole that is costing you standings points.
NBA Fantasy Trade Calculator
Fantasy basketball trades are evaluated differently from football because basketball scoring is more balanced across positions, games are more frequent, and injury management is a bigger factor.
How Basketball Trade Values Work
<cite index=”46-1″>The NBA Trade Analyzer takes much of the guesswork out of trades by comparing players you’re giving up with those you’re getting back, showing side-by-side stats, future projections, and how each deal affects your roster’s balance — especially useful in multifaceted formats like roto or categories leagues.</cite>
Basketball trade values are built from projected per-game contributions across statistical categories, adjusted for:
- Games played (a player who misses 30 games has reduced real value regardless of per-game rate)
- Positional scarcity (true point guards who contribute assists are scarcer than scorers)
- Streaming value vs. must-start value
- Schedule strength and back-to-back game frequency
Categories vs Points Leagues (NBA)
Just like fantasy baseball, NBA fantasy comes in two primary formats:
9-category roto leagues (PTS, REB, AST, STL, BLK, FG%, FT%, 3PM, TO) value players based on their contribution across all nine stats. A player who hurts your team in turnovers but contributes in three other categories needs to be evaluated net — not just on his scoring.
Points leagues value raw fantasy point output. High-volume scorers dominate; a player’s statistical efficiency across categories matters much less.
Z-Score — The Math Behind NBA Trade Evaluation
The most analytically rigorous NBA fantasy trade calculators use z-scores to compare players fairly across categories.
<cite index=”51-1″>FanScout calculates z-scores for each player across chosen categories and sums them — a higher total z-score means the player contributes more above-average production. A z-score measures how far a player’s stats are from the league average in units of standard deviation, and a positive z-score means above-average production. Summing z-scores across all categories gives a single number to compare players fairly.</cite>
In plain English: A z-score tells you how much better or worse than average a player is in each category. A player with a z-score of +2.5 in steals is roughly two and a half standard deviations above the average fantasy basketball player in that stat — meaning he’s elite at it. Adding z-scores across all your categories gives you a single number that fairly represents total value regardless of which stats are larger or smaller in absolute terms.
This makes NBA trade calculators more mathematically rigorous than football calculators, where scoring is aggregated into fantasy points that already carry implicit weight.
How to Read Your Trade Calculator Results
Getting a verdict from a calculator is the easy part. Understanding what it actually means — and what to do with it — is where most fantasy managers underuse the tool.
Understanding Point Gaps and Percentages
Raw point gaps without context are hard to interpret. Here’s a rough framework:
| Gap Size | What It Typically Means | Action |
|---|---|---|
| 0–5% or ~0–300 pts | Essentially even | Trade on roster fit and need |
| 5–10% or ~300–600 pts | Slight edge for one side | Acceptable; negotiate minor adjustments |
| 10–20% or ~600–1,200 pts | Clear advantage | The losing side should want compensation |
| 20–30% or ~1,200–2,000 pts | Significant imbalance | Worth rejecting or significantly restructuring |
| 30%+ or ~2,000+ pts | Lopsided | Don’t do it (or don’t let your league mate) |
Understanding Letter Grade Verdicts
Most calculators use A through F grades for simplicity:
| Grade | Meaning | What to Do |
|---|---|---|
| A / A+ | Strong win — you got significantly more value | Accept if you want the players |
| B / B+ | Slight win — you came out a bit ahead | Generally favorable |
| C | Fair — roughly even value | Decide based on roster need |
| D | Slight loss — you’re giving up more than you’re getting | Negotiate a sweetener |
| F | Lopsided loss — significant value deficit | Decline or restructure |
Fair vs Lopsided — Where the Line Is
The line between “fair” and “lopsided” shifts based on format. In redraft leagues, a 10% gap is meaningful because the season is short and every point matters. In dynasty leagues, a 10% gap on a multi-player deal involving young players and picks is often within the acceptable margin — dynasty values carry significant uncertainty across long time horizons.
In basketball and baseball, category needs can make a “negative” trade correct if it addresses a specific roster deficit that is costing you standings points.
When to Trust the Calculator — and When to Override It
A trade calculator is a decision-support tool, not a final authority. Here’s when to follow it and when to use your judgment.
5 Situations Where the Calculator Is Right
When you’re emotionally attached to a player. Managers frequently overvalue players on their own roster — especially players they drafted or players they’re excited about. If the calculator says a trade is a clear loss and your gut says it’s fine, reconsider whether you’re rationalizing loyalty to a player rather than evaluating value objectively.
When a league mate is applying pressure. “This trade has to happen today” is a classic manipulation tactic in fantasy. Running the numbers removes the emotional urgency and grounds the discussion in value.
When comparing multi-player packages. Trading three players for two is cognitively complex. The calculator handles the math automatically and removes the risk of undervaluing depth or overvaluing quantity.
When you’re new to the league format. If you’re new to dynasty, the values of rookie picks vs. veteran players are genuinely hard to calibrate. A calculator built specifically for dynasty is more reliable than your instinct on these.
For baseline negotiation. Even if you’ll override the calculator, it’s useful for establishing what “fair” looks like before you enter negotiations. Knowing the calculator says your offer is worth X gives you an anchoring point.
5 Situations Where You Should Override It
When roster context matters more than raw value. If you’re a running back-heavy team that just lost a wide receiver to injury, acquiring even a slightly overvalued WR1 is correct. The calculator doesn’t know your depth chart.
When the values haven’t caught up to recent news. Calculators update on various schedules — some daily, some weekly. A player who just got named a starter or suffered an injury in the past 24 hours may still carry their old value. Check injury reports and news before trusting any calculator value at face value.
When you’re a rebuilder trading to a contender. If you’re rebuilding and the calculator grades a trade as “slightly unfair” for you, but you’re exchanging aging veterans for young players and picks, that trade may be exactly right for your team direction — even if the raw calculator score doesn’t reflect it.
When trading for category balance in roto. In baseball and basketball roto leagues, category need is everything. A calculator that just adds raw value misses the strategic dimension of building a roster that wins the standings battle across all categories.
When dynasty values are highly speculative. The further into the future you’re projecting — 2028 draft picks, 19-year-old prospects — the less reliable any calculator’s value assignment becomes. These are educated guesses. Your own research on a player’s trajectory may be more informative than a tool’s numerical assignment.
How to Use a Fantasy Trade Calculator Step by Step
- Set your league format — Choose redraft, dynasty, or keeper. This is the single most important setting. The wrong format produces meaningless results.
- Set your scoring format — PPR, half-PPR, standard, superflex, TE premium. Each changes player values significantly.
- Enter Team A’s assets — Add every player and pick that Team A (you) will send in the trade.
- Enter Team B’s assets — Add every player and pick that Team B will send in return.
- Set contender/rebuilder mode (dynasty only) — Toggle to match your team’s current direction.
- Read the verdict — Check the point gap, percentage, and letter grade. Is it within the fair range?
- Check the breakdown — See how much each individual player contributes to the total. Is one player’s value inflated or deflated compared to your expectations?
- Run alternative scenarios — Swap out players on either side to find a version of the trade that reaches the fair zone. What would it take to balance the deal?
- Cross-reference news — Verify that no player involved has had a recent injury, role change, or news event that the calculator hasn’t yet reflected.
- Make your decision — Use the output as one input among several, alongside roster fit, category needs, and your team’s direction.
6 Common Fantasy Trade Mistakes (And How to Avoid Them)
Overvaluing your own players. <cite index=”42-1″>Fantasy football trades are rarely even — one manager might need a running back while another needs a wide receiver, and the calculator helps you quantify value rather than rationalize your attachment.</cite> If you’ve been starting a player for eight weeks, you have emotional equity in them that inflates your perception of their worth. The calculator doesn’t.
Using the wrong format settings. A PPR calculator in a standard league, or a redraft calculator for a dynasty trade, produces completely wrong verdicts. Always verify your format settings match your actual league before running any analysis.
Ignoring the point gap size. A trade calculator might say “Team B wins” — but if the gap is only 3%, that’s essentially a coin flip. New managers sometimes reject trades that are marginally negative without considering that the roster fit might outweigh a tiny value gap.
Accepting at face value without checking news. Calculator values are updated on a schedule, not in real time. A player who suffered a hamstring injury this morning may still show yesterday’s value. <cite index=”46-1″>When evaluating a trade, don’t just look at headline names — focus on role, opportunity, and fit, and make sure any injury flags are reflected in your analysis.</cite>
Trading based on name recognition alone. Big-name players from last season sometimes carry inflated values in community calculators due to recency of reputation rather than current production or outlook. A player coming off a career year at age 31 may have much less forward value than their name suggests.
Failing to model alternative packages. Most managers either accept or reject the first version of a trade they see. Running the calculator for three or four alternative configurations — what if you added a third player? what if you swapped one of the players out? — often reveals a version of the deal that works for both sides and actually gets done.
Fantasy Trade Calculator FAQ
How does a fantasy trade calculator work? It assigns a numerical value to every player and draft pick based on rankings, projections, or real-trade data, then totals both sides of a proposed trade and compares them. The output — a point gap, percentage, or letter grade — tells you which side has more value and by how much.
What is the difference between a redraft and dynasty fantasy football trade calculator? A redraft calculator values players based on rest-of-season projected points. A dynasty calculator values players based on their expected contribution over multiple years, factoring in age curves, upside, and the value of future draft picks. The same player can have a very different value in each format.
What is the flock fantasy trade calculator? The Flock Fantasy trade calculator is a dynasty and redraft football trade evaluation tool built into the Flock Fantasy platform. It accounts for your specific league settings — size, roster requirements, scoring format — and provides contender vs. rebuilder mode, explanations for each verdict, and recommendations for balancing uneven deals.
How accurate are fantasy trade calculators? They are reliable benchmarks, not guarantees. Accuracy depends on how current the underlying values are, how well the calculator accounts for your league settings, and whether any recent news has shifted a player’s value. They are most accurate for well-known players in standard formats and least accurate for dynasty picks or speculative young players with uncertain roles.
Should I always do what the trade calculator says? No. The calculator is one input among several. It doesn’t know your roster’s specific needs, your team’s direction (rebuild vs. win-now), or category deficits in baseball or basketball roto leagues. Use it to ground your thinking, not to replace it.
What is a dynasty fantasy football trade calculator? A specialized trade tool that values players and rookie draft picks based on long-term worth in a league where rosters carry over year to year. It applies age curves, opportunity projections, and multi-year value windows that standard redraft calculators don’t include.
How do fantasy baseball trade calculators differ from football? Fantasy baseball calculators account for rest-of-season value, rotisserie category contributions (not just fantasy points), and league-specific scoring (5×5 roto vs. points). They also weight positional scarcity and category balance — two factors that don’t apply in the same way to football.
How does an NBA fantasy trade calculator work? NBA trade calculators compare players using either projected fantasy points (for points leagues) or z-scores across statistical categories (for category leagues). A z-score measures how much above or below average a player is in each stat, and summing z-scores across all categories gives a single comparable number for each player.
What does “superflex” mean for trade values? In superflex leagues, managers can start a second quarterback as a flex option. This dramatically increases quarterback scarcity and therefore QB value — often making elite QBs the most valuable trade assets in dynasty leagues. Superflex trade calculators apply a significant QB premium that standard 1QB calculators do not.
Conclusion
A fantasy trade calculator is the fastest, most reliable way to answer the question every fantasy manager faces multiple times a season: is this deal actually fair?
The best calculators account for your league format, your scoring system, the direction your team is heading, and the current state of every player involved. They won’t make every decision for you — roster fit, category needs, and recent news all belong in the conversation — but they give you an analytical foundation that gut feelings alone never can.
Use this tool page’s calculator to evaluate your next trade across NFL redraft, dynasty football, fantasy baseball, or NBA fantasy. Enter your players and picks, set your format, and get a verdict in seconds — before you send that offer or press accept.
Visit Our More Calculators